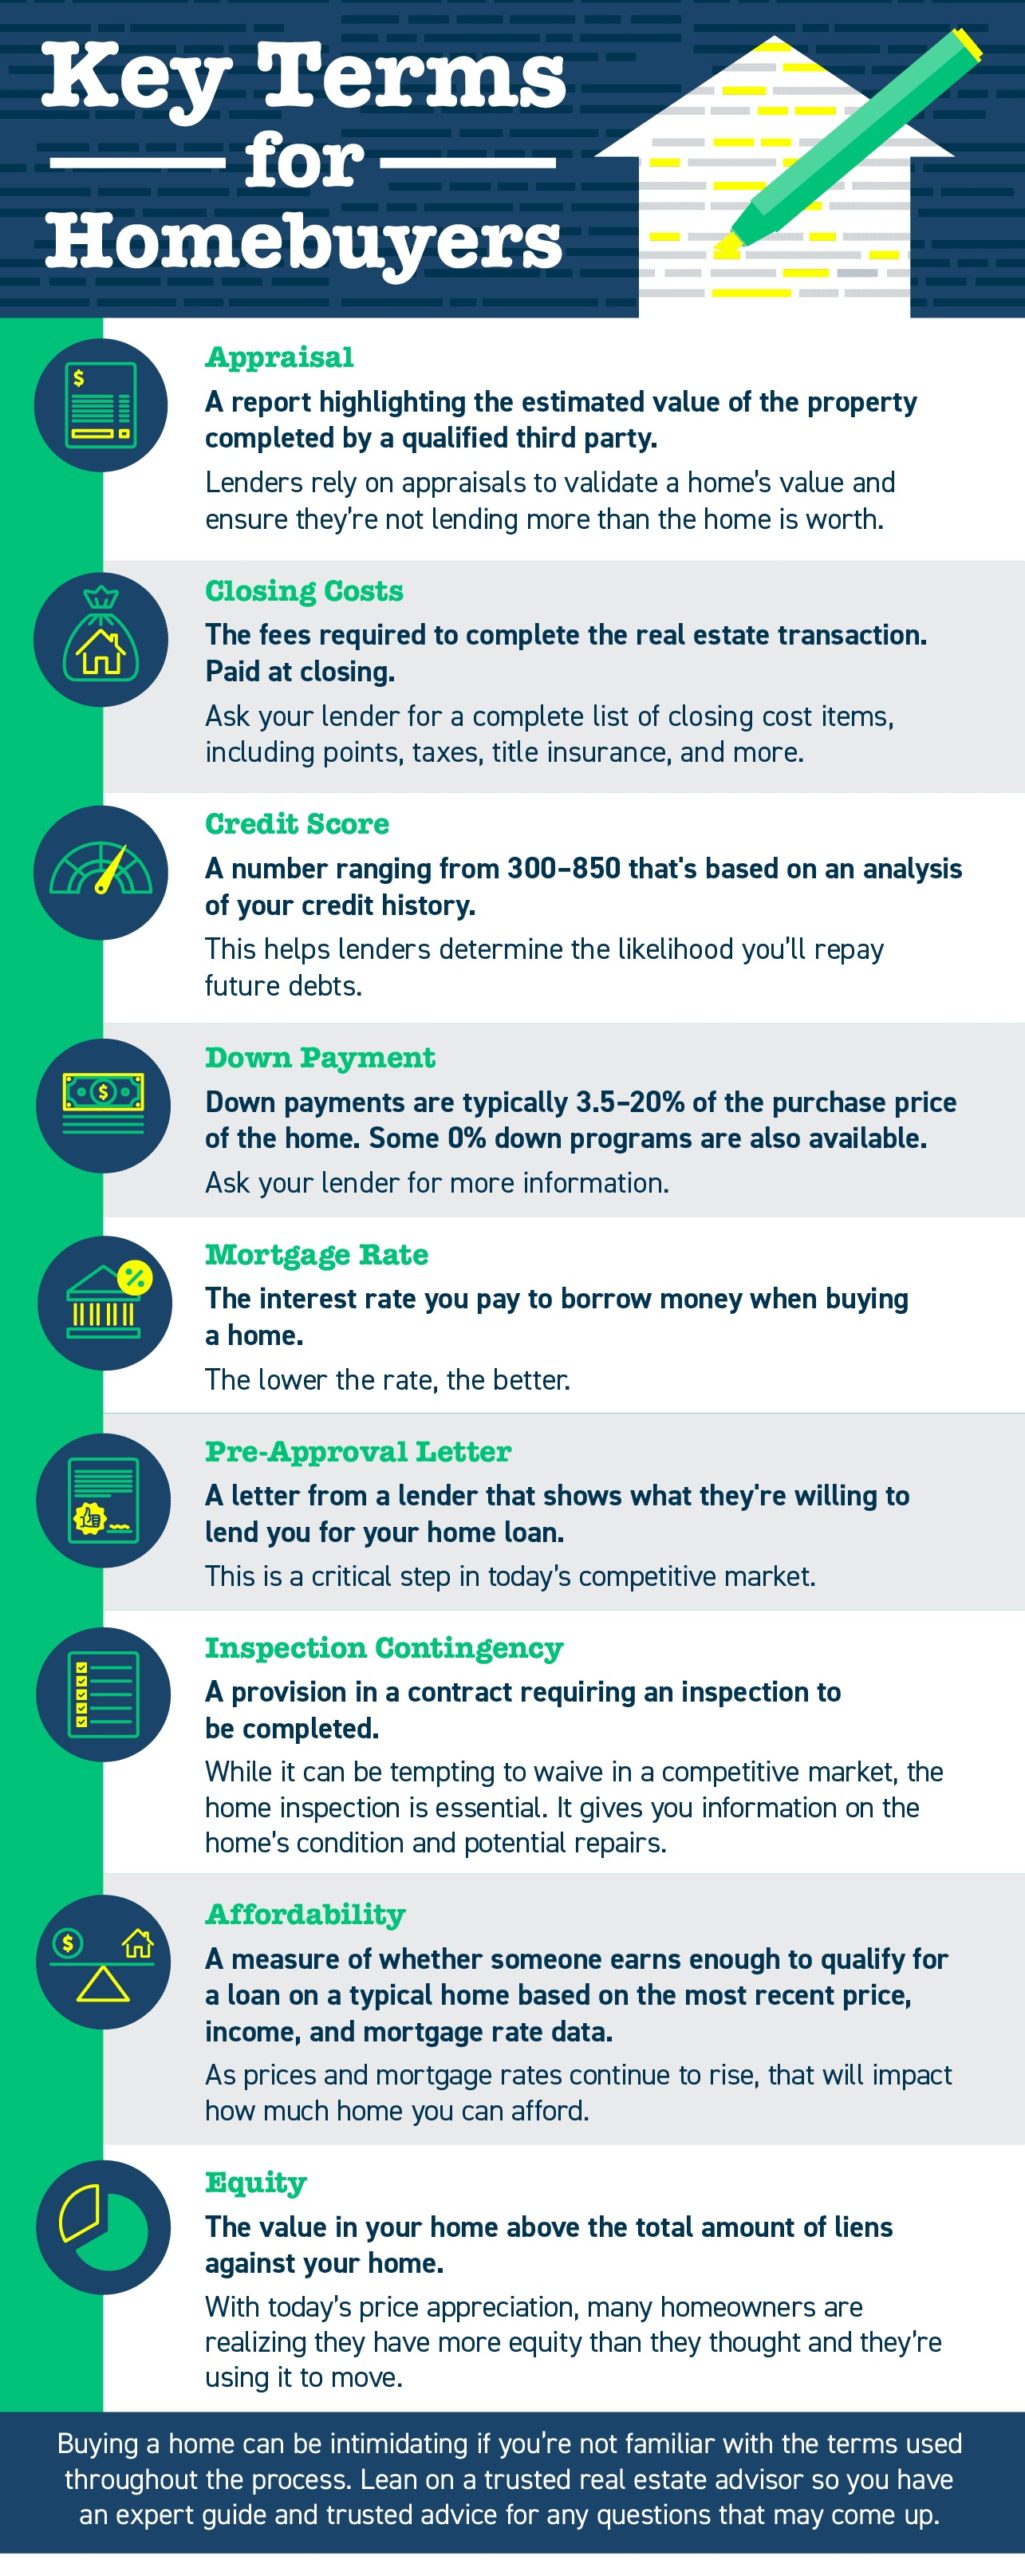
Veterans Day is an official United States public holiday, observed annually on November 11, that honors military veterans, that is, persons who served in the United States Armed Forces. It coincides with other holidays, including Armistice Day and Remembrance Day, celebrated in other countries that mark the anniversary of the end of World War I; major hostilities of World War I were formally ended at the 11th hour of the 11th day of the 11th month of 1918, when the Armistice with Germany went into effect. The United States previously observed Armistice Day. The U.S. holiday was renamed Veterans Day in 1954.
Veterans Day is not to be confused with Memorial Day; Veterans Day celebrates the service of all U.S. military veterans, while Memorial Day honors those who died while in military service.
U.S. sales of existing homes recently fell to a 13-year low, dropping 2.0% month-over-month and 15.4% year-over-year as of last measure, according to the National Association of REALTORS® (NAR), as surging interest rates and elevated sales prices continue to make homeownership unaffordable for many prospective buyers. Purchase activity is down significantly compared to this time last year, but rising interest rates are also keeping many current homeowners from selling, causing inventory to remain at historically low levels nationwide.
Closed Sales decreased 7.5 percent for Detached homes but increased 10.8 percent for Attached homes. Pending Sales decreased 10.2 percent for Detached homes but increased 28.7 percent for Attached homes.
The Median Sales Price was up 18.6 percent to $1,150,000 for Detached homes and 13.1 percent to $735,000 for Attached homes.
Days on Market decreased 16.7 percent for Detached homes and 36.7 percent for Attached homes.
Supply decreased 28.0 percent for Detached homes and 36.4 percent for Attached homes
Total housing inventory going into October was at 1.13 million units, up 2.7% from the previous month but down 8.1% compared to the same time last year, for a 3.4 months’ supply at the current sales pace, according to NAR. The shortage of homes for sale is making it harder for buyers to find a home to purchase while at the same time pushing sales prices higher nationwide, with the median existing-home sales price rising 2.8% annually to $394,300, the third consecutive month of year-over-year price increases.
National sales of existing homes recently fell to a 7-month low, as surging borrowing costs, rising sales prices, and limited inventory continue to keep many would-be buyers out of the market. Borrowers have become increasingly sensitive to fluctuations in mortgage rates, which have remained above 7% since mid-August. With fewer buyers able to afford the costs of homeownership, existing-home sales declined 0.7% month-over-month and were down 15.3% year-over-year, according to the National Association of REALTORS®(NAR).
Closed Sales decreased 23.1 percent for Detached homes and 25.0 percent for Attached homes.
Pending Sales decreased 14.3 percent for Detached homes but increased 0.8 percent for Attached homes.
The Median Sales Price was up 15.1 percent to $1,122,500 for Detached homes and 8.5 percent to $705,571 for Attached homes.
Days on Market decreased 13.8 percent for Detached homes and 44.4 percent for Attached homes. Supply decreased 32.0 percent for Detached homes and 33.3 percent for Attached homes.
Prices have continued to increase this fall despite softening home sales nationwide, as a lack of inventory has kept the market competitive for prospective buyers, sparking bidding wars and causing homes to sell for above asking price in some areas.
Heading into September there were only 1.1 million units available for sale, 0.9% fewer than a month ago and 14.1% fewer than the same period last year, according to NAR. As a result, the U.S. median existing-home sales price rose 3.9% year-over-year to $407,100, marking the third consecutive month that the median sales price topped $400,000.
Hi folks, If you are going to be selling your home in the near future or are just curious about its value in today’s market, give me a call or use the button below. I will email you a comprehensive market analysis of your home. There is no obligation on your part and it is totally free.
Not ready to move yet but want to keep an eye on your homes value, I have a monthly update that is customized to your home and neighborhood. Click the link below to see what is included in the report and to sign up:
Higher mortgage rates, along with elevated sales prices and a lack of housing inventory, have continued to impact market activity during the summer homebuying season. The average 30-year fixed-rate mortgage has remained above 6.5% since May, recently hitting a two-decade high in August, according to Freddie Mac. As a result, existing-home sales have continued to slow nationwide, dropping 2.2% month-over-month as of last measure, with sales down 16.6% compared to the same time last year, according to the National Association of REALTORS® (NAR).
Falling home sales have done little to cool home prices, however, which have continued to sit at record high levels nationally thanks to a limited supply of homes for sale. According to NAR, there were 1.11 million homes for sale heading into August, 14.6% fewer homes than the same period last year, for a 3.3 months’ supply at the current sales pace. The shortage of homes for sale has boosted competition for available properties and is driving sales prices higher, with NAR reporting a national median existing-home price of $406,700, a 1.9% increase from a year earlier.
North County Overview:
Closed Sales decreased 12.1 percent for Detached homes and 19.6 percent for Attached homes.
Pending Sales decreased 21.7 percent for Detached homes and 16.7 percent for Attached homes.
The Median Sales Price was up 14.0 percent to $1,127,150 for Detached homes and 8.6 percent to $730,000 for Attached homes.
Days on Market decreased 8.3 percent for Detached homes and 22.7 percent for Attached homes.
Supply decreased 29.2 percent for Detached homes and 38.1 percent for Attached homes.
City Overview: Holding fairly steady with regard to Price, Days on Market, number of sold and active listings.
Carlsbad
Month
Avg Sold $
Chg
DOM
Chg
Sold Homes
Chg
Act. Listings
Chg
% List Price
YoY Chg
08/23
$1,815,000
-2%
15
7%
191
7%
104
1%
99.6%
0.7%
07/23
$1,861,000
-3%
14
0%
179
15%
103
6%
100.0%
2.2%
06/23
$1,920,000
1%
14
-26%
156
-3%
97
23%
100.3%
3.0%
05/23
$1,900,000
6%
19
-17%
161
15%
79
22%
100.0%
2.4%
04/23
$1,793,000
8%
23
-26%
140
9%
65
5%
98.4%
-0.8%
03/23
$1,657,000
4%
31
0%
128
35%
62
-2%
96.9%
0.8%
02/23
$1,594,000
-0%
31
11%
95
-17%
63
-19%
95.5%
5.1%
01/23
$1,598,000
-2%
28
0%
114
-10%
78
-21%
95.9%
4.1%
12/22
$1,623,000
2%
28
-7%
127
-19%
99
-14%
94.4%
4.9%
11/22
$1,587,000
-2%
30
0%
156
-4%
115
-9%
94.0%
3.1%
10/22
$1,614,000
-5%
30
25%
162
-14%
127
-16%
94.9%
5.0%
09/22
$1,703,600
-5%
24
41%
188
-12%
151
-11%
95.8%
14.3%
08/22
$1,802,279
-1%
17
42%
213
-4%
169
1%
98.9%
22.4%
07/22
$1,821,026
-2%
12
20%
223
-4%
167
19%
102.8%
27.6%
06/22
$1,863,624
0%
10
0%
233
4%
140
37%
106.7%
29.5%
05/22
$1,855,969
3%
10
-17%
223
6%
102
36%
109.4%
26.2%
04/22
$1,807,471
10%
12
-20%
210
12%
75
9%
109.5%
23.3%
03/22
$1,643,465
8%
15
-12%
187
-6%
69
-5%
107.4%
16.1%
02/22
$1,516,065
-1%
17
6%
198
-14%
73
-17%
104.4%
20.7%
01/22
$1,535,059
-1%
16
0%
231
-17%
88
-15%
103.0%
30.4%
Encinitas
Month
Avg Sold $
Chg
DOM
Chg
Sold Homes
Chg
Act. Listings
Chg
% List Price
YoY Chg
08/23
$2,640,000
3%
21
-5%
82
0%
48
7%
100.0%
-1.1%
07/23
$2,560,000
1%
22
16%
82
-1%
45
0%
99.7%
-3.4%
06/23
$2,523,000
1%
19
-21%
83
2%
45
2%
98.7%
-2.7%
05/23
$2,496,000
-4%
24
-11%
81
31%
44
13%
98%
-3.7%
04/23
$2,592,000
2%
27
-18%
62
19%
39
3%
97.1%
6.4%
03/23
$2,542,000
22%
33
-8%
52
0%
38
-16%
94.9%
17.2%
02/23
$2,077,000
2%
36
13%
52
0%
45
-4%
92.2%
1.2%
01/23
$2,028,000
-10%
32
-3%
52
-15%
47
-10%
93.4%
-5.9%
12/22
$2,255,000
-4%
33
18%
61
-5%
52
-5%
92.5%
1.3%
11/22
$2,343,000
-6%
28
-10%
64
-7%
55
4%
93.4%
3.9%
10/22
$2,505,000
-4%
31
11%
69
1%
53
-5%
93.2%
10.3%
09/22
$2,604,000
-2%
28
40%
68
-3%
56
-3%
94.4%
13.3%
08/22
$2,668,944
1%
20
54%
70
-17%
58
4%
98.1%
25.6%
07/22
$2,650,404
2%
13
0%
84
-18%
56
14%
103.1%
31.3%
06/22
$2,592,614
0%
13
-19%
103
-9%
49
20%
105.6%
31.3%
05/22
$2,590,593
6%
16
7%
113
18%
41
21%
106.7%
30.1%
04/22
$2,435,887
12%
15
-25%
96
12%
34
-6%
106.9%
24.8%
03/22
$2,169,582
6%
20
-9%
86
8%
36
-14%
104.7%
17.3%
02/22
$2,052,570
-5%
22
-19%
80
-7%
42
-19%
103.1%
17.5%
01/22
$2,155,319
-3%
27
13%
86
-7%
52
-13%
101.8%
27.7%
Oceanside
Month
Avg Sold $
Chg
DOM
Chg
Sold Homes
Chg
Active Listings
Chg
% List Price
YoY Chg
08/23
$971,000
-0%
14
0%
259
7%
103
-7%
101.5%
4.9%
07/23
$974,000
-2%
14
-22%
243
3%
111
10%
102.1%
-0.6%
06/23
$997,000
1%
18
-33%
236
2%
101
6%
101.1%
2.6%
05/23
$988,000
0%
27
-18%
232
12%
95
17%
100%
0.9%
04/23
$984,000
7%
33
-11%
208
7%
81
-21%
98.5%
5.6%
03/23
$923,000
-2%
37
9%
194
10%
103
-18%
97.2%
3.0%
02/23
$938,000
1%
34
0%
176
-7%
125
-15%
96.1%
14.0%
01/23
$933,000
-0%
34
17%
190
-16%
147
-15%
95.2%
9.5%
12/22
$934,000
3%
29
4%
225
-11%
173
-9%
95.3%
9.8%
11/22
$911,000
3%
28
12%
254
-14%
190
-2%
95.4%
3.9%
10/22
$885,000
-2%
25
4%
296
-2%
193
-6%
97.4%
6.3%
09/22
$904,283
-2%
24
33%
303
-1%
206
-8%
96.8%
11.3%
08/22
$926,014
-5%
18
38%
307
-4%
223
2%
99.1%
15.5%
07/22
$979,524
1%
13
18%
321
-17%
218
14%
102.3%
23.2%
06/22
$971,761
-1%
11
-15%
385
-9%
191
24%
104.8%
21.9%
05/22
$979,346
5%
13
-13%
421
9%
154
18%
105.8%
25.8%
04/22
$931,893
4%
15
-12%
386
21%
130
5%
105.7%
21.6%
03/22
$896,065
9%
17
6%
318
-2%
124
-5%
104.7%
19.7%
02/22
$823,005
-3%
16
7%
324
-11%
130
-10%
103.1%
18.4%
01/22
$852,143
0%
15
7%
364
-15%
144
-7%
102.9%
24.9%
San Marcos
Month
Avg Sold $
Chg
DOM
Chg
Sold Homes
Chg
Active Listings
Chg
% List Price
YoY Chg
08/23
$1,185,000
-0%
18
-14%
125
1%
39
5%
101.1%
7.9%
07/23
$1,186,000
3%
21
11%
124
-6%
37
-12%
100.6%
3.8%
06/23
$1,154,000
3%
19
-5%
132
5%
42
5%
100.1%
4.9%
05/23
$1,123,000
1%
20
-29%
126
13%
40
-9%
99.3%
3.4%
04/23
$1,113,000
9%
28
-20%
112
8%
44
-19%
98.7%
5.6%
03/23
$1,017,000
2%
35
-3%
104
16%
54
-17%
97.3%
-1.9%
02/23
$996,000
2%
36
24%
90
-14%
65
-14%
95.5%
1.5%
01/23
$972,000
2%
29
7%
105
-15%
76
-16%
95.2%
-2.1%
12/22
$951,000
-2%
27
8%
123
-22%
90
-11%
94.6%
-1.0%
11/22
$974,000
-1%
25
9%
158
-3%
101
-6%
95.0%
2.8%
10/22
$985,000
-6%
23
10%
163
-8%
107
-8%
95.8%
6.4%
09/22
$1,047,000
-5%
21
31%
177
-3%
116
-6%
96.9%
11.5%
08/22
$1,098,000
-4%
16
23%
183
-11%
123
6%
99.8%
13.8%
07/22
$1,143,000
4%
13
8%
205
-8%
116
20%
102.9%
17.7%
06/22
$1,100,617
1%
12
0%
222
-1%
97
28%
105.0%
14.8%
05/22
$1,085,769
3%
12
0%
224
11%
76
13%
106.7%
19.0%
04/22
$1,053,808
2%
12
0%
201
10%
67
8%
107.3%
18.6%
03/22
$1,036,353
6%
12
0%
183
-4%
62
3%
106.9%
24.5%
02/22
$981,319
-1%
12
-20%
190
-6%
60
-5%
105.0%
21.0%
01/22
$993,196
3%
15
0%
203
-11%
63
-7%
103.0%
26.5%
Vista
Month
Avg Sold $
Chg
DOM
Chg
Sold Homes
Chg
Active Listings
Chg
% List Price
YoY Chg
08/23
$998,000
2%
16
7%
170
16%
84
2%
101.4%
8.7%
07/23
$982,000
2%
15
-6%
147
20%
82
6%
102.1%
7.6%
06/23
$964,000
3%
16
-20%
123
-8%
77
38%
100.2%
1.6%
05/23
$936,000
0%
20
-13%
134
8%
56
10%
99.3%
-1.0%
04/23
$935,000
8%
23
-21%
124
-6%
51
-16%
98.7%
0.9%
03/23
$863,000
3%
29
-17%
132
27%
61
-10%
97.5%
-3.7%
02/23
$835,000
2%
35
-3%
104
-10%
68
-22%
95.3%
-5.5%
01/23
$820,000
-1%
36
20%
116
-6%
87
-19%
94.2%
-7.2%
12/22
$828,000
-3%
30
11%
124
-24%
107
-18%
95.3%
-3.6%
11/22
$851,945
-6%
27
17%
163
-11%
131
-11%
95.9%
2.2%
10/22
$906,273
-0%
23
21%
183
-9%
147
-10%
96.6%
13.6%
09/22
$910,549
-1%
19
19%
201
3%
163
3%
97.4%
15.3%
08/22
$918,464
1%
16
33%
196
-14%
159
10%
98.6%
18.5%
07/22
$913,029
-4%
12
9%
227
-12%
144
21%
101.7%
18.4%
06/22
$948,425
0%
11
10%
258
-3%
119
24%
105.5%
24.0%
05/22
$945,910
2%
10
-9%
267
12%
96
17%
107.0%
25.8%
04/22
$926,864
3%
11
-21%
238
11%
82
15%
107.4%
28.8%
03/22
$896,549
1%
14
-13%
214
-3%
71
9%
104.8%
30.0%
02/22
$883,560
-0%
16
-6%
220
-8%
65
-12%
103.4%
34.0%
01/22
$883,907
3%
17
0%
240
-3%
74
-17%
102.6%
31.6%
Hi folks, If you are going to be selling your home in the near future or are just curious about its value in today’s market, give me a call or use the button below. I will email you a comprehensive market analysis of your home. There is no obligation on your part and it is totally free.
Not ready to move yet but want to keep an eye on your homes value, I have a monthly update that is customized to your home and neighborhood. Click the link below to see what is included in the report and to sign up:
So you want to remodel your bathroom? Then congratulations and a fair warning are both in order. Because whether you’re simply upgrading your sink or ripping out every last tile, it takes tons of research to get a successful bathroom renovation right.
Before you obsess over faucets, the first step is to ask yourself some basic questions, to assess your wants and needs. Here’s a guide to help in your decisions.
1. How much can you spend?
The average bathroom remodel will cost $20,420, but that will vary widely, based on what you do. Even a simple toilet can range from hundreds to thousands of dollars. “On average, you should budget $10,000 to $30,000,” says Paloma Contreras, a Houston-based interior designer behind La Dolce Vita.
“Learning how much you have to spend also eliminates falling in love with items that don’t fit your budget,” says Rick Johnson of STL Remodeling and General Contracting in Groton, MA. And don’t worry, having a minuscule budget doesn’t mean limiting your options that much, there are great deals out there in every price range.
2. Who will be using the bathroom?
Consider who will be using the bathroom to help you whittle down your choices. For instance, if kids will be using the bathroom, you’ll definitely want a tub, or tub/shower combo. A tub is also key feature when it comes time to resell—at least for buyers with families.
However, if it is mainly adults who will be using the bathroom, and if you already have a tub elsewhere, “I always recommend installing a walk-in shower in one,” says Harder. The reason: Showers generally get more use than tubs, and open shower designs are a hot trend right now. They also take up less room, at 12 square feet, whereas a standard tub takes up 15 square feet.
You also need to consider who will be using the bathroom when you’re choosing the flooring. “While a polished floor may look amazing, it can be an incredibly dangerous slip hazard,” says Jennifer Harder, founder and CEO of Jennifer Harder Mortgage Brokers, who has worked on numerous bathroom remodels. Slippery floors are particularly dangerous for the old and for the young. Then, it’s best to avoid carpeting and wood, which can develop mold or warp. The sensible choice is usually between tile and laminate, so you might want to limit your search to those materials.
3. Do you want a bigger bathroom or one the same size?
The average bathroom is 40 square feet, which may be cramped if you dream of an expansive oasis. If you want to expand, you probably can. But it will mean moving walls, downsizing adjoining rooms, or carving out space from closets.
The upside of expanding is obvious: more room to relax! Additionally, fantastic bathrooms do help sell homes. The downside? Such renovations are pricy and will extend the time you’ll need. An upscale remodel, meanwhile, won’t bring the same return on investment as a low to mid-range one.
With advances in technology and new ways to utilize data, some companies have sprouted up to create different ways to sell your property.
Basically, they utilize automated valuation models (AVMs) to make quick offers on homes, allowing
them to close in a much faster than typical timeframe, and then resell them.
From a seller’s standpoint, it can eliminate some hassle and uncertainty, but with high “transaction fees” ranging from 7% to 14%, and the likelihood that they will sell the home for more than they paid you for it, you are simply exchanging that smooth and quick transaction for a portion of your equity.
Companies that offer this kind of service are only in limited markets across the country right now. They operate by having homeowners fill out a short questionnaire with information on their home. They feed that data into their AVM, which kicks back an offer price. They make the homeowner a cash offer to close in a short timeframe (typically about a week) and specify what the fee will be to proceed through to closing. Once they own the home, they will repair and spruce it up, and list it for sale on the open market.
It may be tempting to consider such an offer, but keep in mind that this is a straight numbers play. They are determining a price that allows them the room to cover the costs of the transactions as well as the repairs, while still making some profit. Their profit will either come from the fee you’ve paid or from acquiring your home at a below market price – although it could possibly be a combination of the two.
n analysis on one company’s transactions showed they were selling homes at an average 5.5% appreciation, on top of their transaction fee. That’s a lot of money to leave on the table for a little convenience.
There are other companies beginning to test alternative listing models as well, utilizing technology and AVMs to make ‘instant offers’ on homes, or to help buyers acquire and move into their next home before selling their current one. As always, it’s important to read the fine print and understand what you are agreeing to before using the service.
Hi folks, If you are going to be selling your home in the near future or are just curious about its value in today’s market, give me a call or use the button below. I will email you a comprehensive market analysis of your home. There is no obligation on your part and it is totally free.
Not ready to move yet but want to keep an eye on your homes value, I have a monthly update that is customized to your home and neighborhood. Click the link below to see what is included in the report and to sign up:
Loan application and pre-qualification sheet are filled out
Obtain all necessary documents: W-2’s, tax returns; bank statements; paycheck stubs.
Review loan programs and how rate lock works
Application Processing 10 to 30 days:
1) Set Up
Send out missing items request for items not obtained
Order title information, credit report, appraisal
verification of employment, funds on deposit and landlord
2) Review
Review missing items that have been received
Confirm information on verification’s and review for any additional requests
Review credit report, appraisal and verification’s
3) Workup
Review loan package for completeness
Prepare loan paperwork
Work up forms for the underwriter
Underwriting 2 to 3 days:
Submit completed loan package for approval – Normally 48 hour turn around. The loan is approved or rejected. Loan approval may be with conditions to be met before loan funding
What is loan underwriting? Mortgage loan underwriting is a process involving the analysis of your income, assets and credit to determine if you meet the requirements for the mortgage product you are applying for. The underwriter also focuses a great deal of attention on the home that is being financed to make sure the value is sufficient, the home is safe and habitable and the title of the property can be transferred without any issues like prior tax liens, judgments or zoning problems.
The foundation of loan underwriting is built on a concept called the 3 C’s of underwriting. The factors are credit reputation, capacity to repay loan and collateral, appraisal value of home + down payment.
Title 1 to 3 days:
Draw loan documents and send to escrow/title company
Buyer & Seller sign their respective documents
Signed documents and funding package sent from escrow/title company to lender
Lender reviews package to ensure all conditions have been met
Closing of Escrow:
Funds issued to escrow company for disbursement to seller